What is the Laryngograph® Speech Studio system?
Laryngograph® Speech Studio system can be used for the non-invasive analysis of speech, sustained vowels and the singing voice. It has a hardware component (electrodes, microphone, digital Laryngograph microprocessor, computer) and a software programme (Speech Studio®). The acoustic signal (voice) is recorded via a microphone and the electrolaryngograph signal via two electrodes placed over on either side of the larynx. The microphone and electrodes are connected to a digital Laryngograph microprocessor (Figure 1) which in turn is connected to the computer. The two synchronised and processed signals can then be analysed using the Speech Studio programme and series of measurements obtained to give quantitative measurements of the voice and vocal fold vibratory activity.

How is the Laryngograph signal generated?
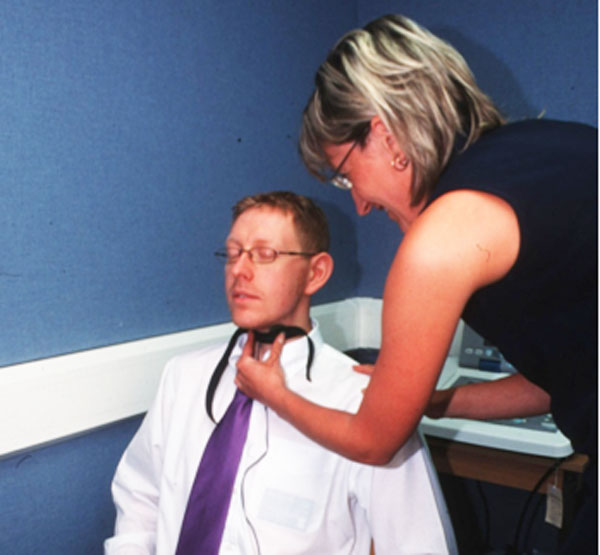
The Laryngograph signal is obtained by placing two electrodes on the skin on either side of the thyroid cartilage of the larynx (Figure 2). A harmless high frequency current (3 MHz) is applied between the two electrodes held at a constant voltage. When the vocal folds vibrate there is a change in electrical conductance between the electrodes which reflects the change in contact area between the mucosa of the two vocal folds during a vibratory cycle. This signal is displayed on the computer screen as the Laryngograph waveform (Lx).
The synchronously acquired acoustic waveform can also be seen (Figure ).

What is the Laryngograph waveform (Lx waveform) and what information does it give?
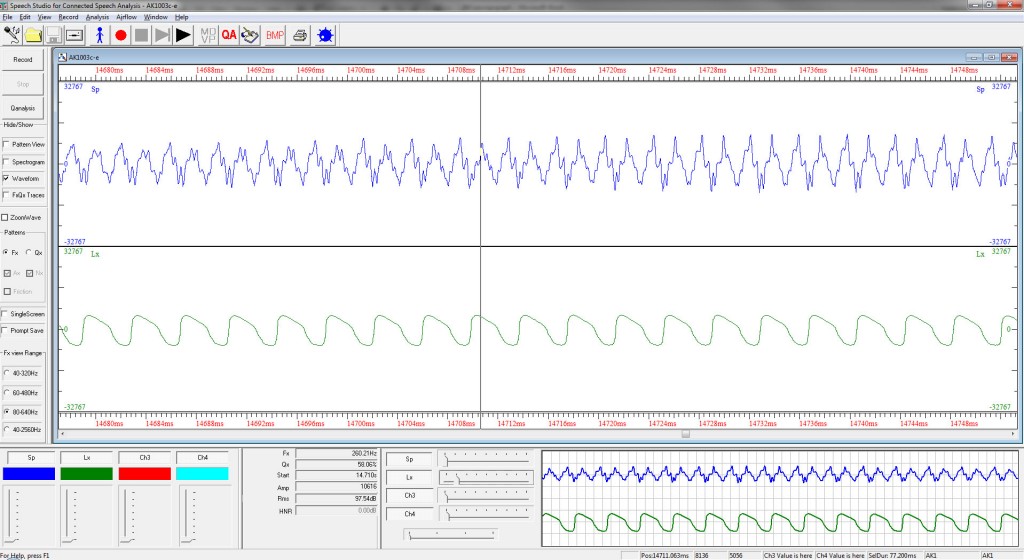
The Laryngograph waveform (Lx waveform) is the graphical display of the Laryngograph signal as seen on the computer screen in the Speech Studio programme. This change can be seen in changes in height of the Laryngograph waveform with time (Figure 3).

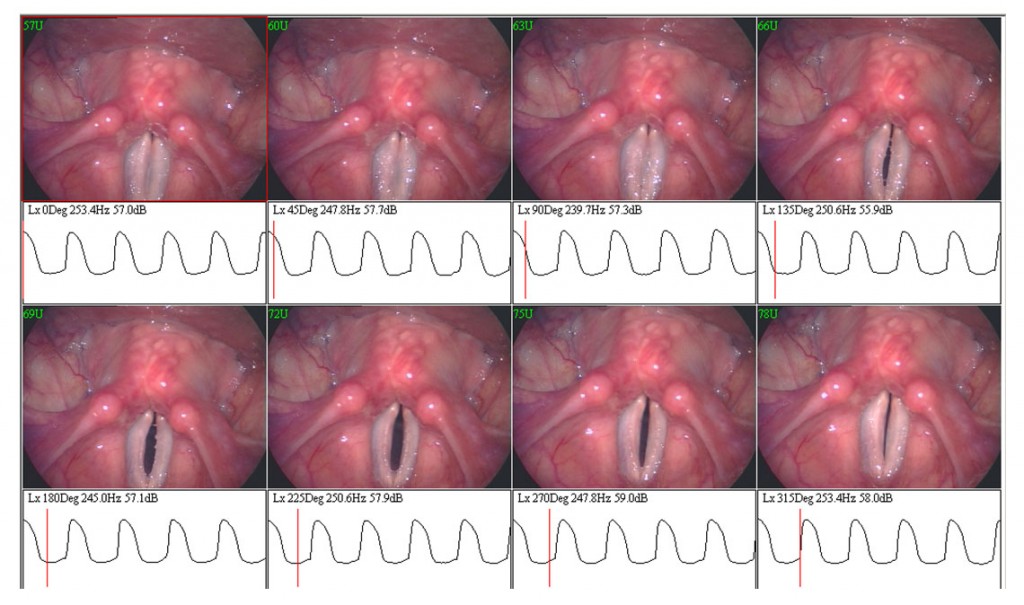
The peak of the waveform reflects the point where there is maximum passage of current which corresponds to the point of maximum contact between the vocal folds while the trough is when the vocal folds are apart during the vibratory cycle (Figure 4).

The width of the waveform reflects how long the vocal folds are in contact during a vibratory cycle (Figure 5) while the time taken to get from one point on the waveform to the same point on the next waveform is called a period.

In other words it is possible to get information about the fundamental frequency (Fx) of vocal fold vibration and how the vocal folds close and open by looking at the shape of the upward and downward slopes of the waveform and how long they stay closed for (Contact Quotient (Qx)). Information from the Laryngograph signal and waveform can be analysed in the Speech Studio programme to give quantitative measurements of how the vocal folds are vibrating in speech, singing and on a sustained vowel.
What statistical measures can you get from the Speech Studio system?
These are slightly different depending on whether the sound sample is:
- A. a sustained vowel
- B. fluent speech or sung sound sample
A. For sustained vowels:
A vowel sound such as a, e, i, o, u, y, is produced for a prolonged period (minimum of 0.5 seconds) at a constant pitch and loudness.
1. Measures obtained from Laryngograph signal:
a. Frequency measures
I. Average Fundamental frequency (Fx) Hz
II. Standard Deviation of Fx (SD Fx) %
III. Jitter First %
IV. Jitter Second %
V. Jitter factor %
b. Contact measures
I. Average Contact Quotient (Qx) %
II. Standard Deviation of Qx (SD Qx) %
2. Measures obtained from acoustic signal:
a. Acoustic measures
I. Shimmer+ %
II. Shimmer- %
III. Shimmer dB
IV. Relative Average Perturbation (RAP) %
V. Normalised Noise Energy (NNE) dB
VI. Harmonics to Noise Ration (HNR) dB
VII. Cepstral Peak Prominence(CPP)
VIII. Mean Speech Pressure Level (SPL) dB
IX. Long Term Average Spectrum (LATS)
B. For fluent speech or sung sound sample:
1. Measures obtained from Laryngograph signal: (NB: Prefix ‘D’ means ‘Distribution’)
a. Frequency measures (Fx) Hz
I. Mean (DFx1 & DFx2) Hz
II. Mode (DFx1 & DFx2) Hz
III. Median (DFx1 & DFx2) Hz
IV. Standard Deviation of Frequency Fx and Octave (DFx1 & DFx2) Hz
V. Coherence %
VI. 80% and 90% Range Hz/Octaves
VII. Irregularity Score (CFx)%
b. Contact measures (Qx) %
I. Mean (DQx1 & DQx2) %
II. Mode (DQx1 & DQx2) %
III. Median (DQx1 & DQx2) %
IV. Standard Deviation (DQx1 & DQx2) %
V. Coherence % VI. 80% and 90% Range %
VII. Irregularity Score (CQx)%
2. Measure obtained from acoustic signal:
a. Acoustic measures: Sound Pressure Level (dB)
I. Mean (DAx1 & DAx2) dB
II. Mode (DAx1 & DAx2) dB
III. Median (DAx1 & DAx2) dB
IV. Standard Deviation of (DAx1 & DAx2) dB
V. Coherence % VI. 80% and 90% Range dB
VII. Irregularity Score (CAx) %
(Explanation and examples of these measures to follow)
Figure 1: The new EGG-400 Microprocessor, gold plated electrodes and tie-clip microphone from Laryngograph®.
Figure 2: Positioning the electrodes over the thyroid cartilage of the larynx. They are secured with a Velcro neck band.
Figure 3: A screen shot from the Speech Studio software programme (Laryngograph®) showing the Acoustic waveform (Sp) from the microphone and the Laryngograph waveform (Lx) for a male singer making a sustained vowel EH sound (as in ‘stay’) in Overdrive. The black vertical line marks the point where quantitative measurements were taken which are displayed in the box below the waveforms. It can be seen be seen that the Fundamental frequency (Fx)=260.21 (‘middle’ C), the Contact Quotient (QX)=58.06%, and the Sound Pressure Level=97.54dB.
Figure 4: A screen shot of the synchronised stroboscopic images with the Laryngograph waveform taken at eight points of a vibratory cycle. A cycle is considered to be 360 degrees so each image is taken at 45 degree steps throughout the cycle (see stroboscopy section). You can see how the Laryngograph waveform changes with the closing and opening of the vocal folds.
Figure 5: Examples of a Laryngograph waveform and Acoustic waveform for a normal voice (in Overdrive) and a breathy voice (Neutral with air) where the vocal folds are just making contact. A period is the time (in seconds) taken to complete one vibratory cycle. The Contact Quotient (Qx) is calculated by measuring the width of the waveform (seconds) at a point 70% of the HEIGHT from the peak of the waveform and dividing it by the period. The result is multiplied by 100 to give the Contact Quotient as a percentage (%).
Written by: Julian McGlashan
